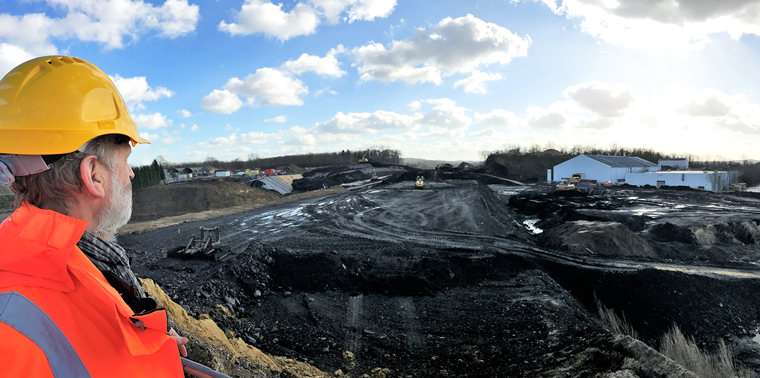

August 20, 2018 —  Transitions by definition are disruptive. Whether it’s switching jobs, electing new leaders, passing laws or adopting innovative technologies, some people gain while others lose. So it’s no surprise that, just as manure shovel manufacturers found the switch to horseless carriages shaking up their world, the current shift from fossil fuels to low-carbon energy sources, though ultimately beneficial to all of us, will cause pain to some people in the form of lost jobs, destabilized communities and more.
If we move into the energy transition with eyes wide open to the costs involved, we can work to eliminate or minimize them where possible, and justly distribute and compensate for them where not. But first we need a way to figure out what those costs are and who is bearing them.
In a paper published earlier this month in Nature Energy, Sanya Carley of the Indiana University School of Public and Environmental Affairs and colleagues propose a strategy for doing just that. Based on a framework developed more than a decade ago to characterize vulnerability to climate change, the researchers created and tested a tool for quantifying and comparing the impact of changes in energy policy or practice on different populations.
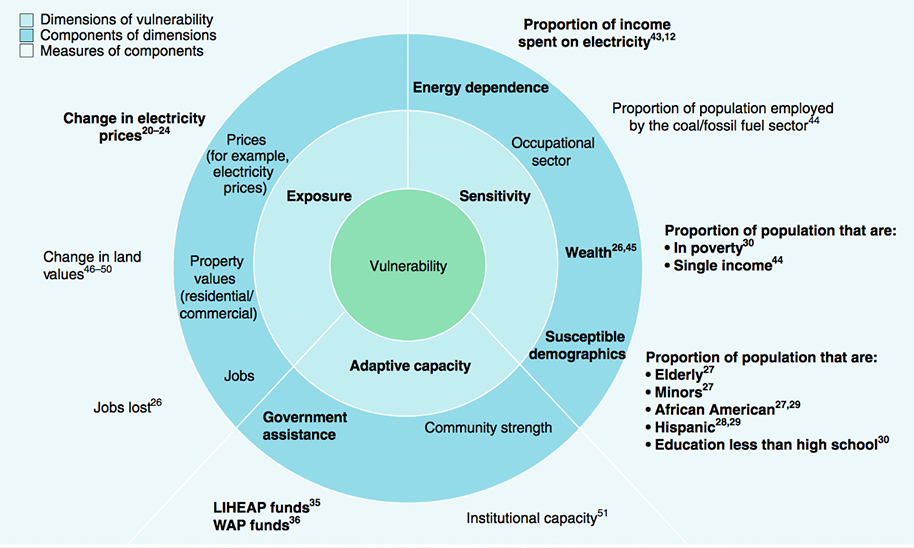
Vulnerability to negative impacts of energy policy is influenced by exposure, sensitivity and adaptive capacity. Reprinted by permission from Springer Nature, Nature Energy, A framework for evaluating geographic disparities in energy transition vulnerability, S. Carley et al, 2018. Numbers refer to references in original paper. Click to expand.
The tool, known as the vulnerability scoping diagram (VSD), merges three core elements of vulnerability: exposure (the extent to which a population experiences the consequences of the change), sensitivity (the extent to which the population is likely to be harmed) and adaptive capacity (the ability of the population to minimize the severity of the harm). Numbers representing the magnitude of each are combined to create a vulnerability score that can then be used to visualize the relative impact of the change on individuals, communities or regions.
To demonstrate the tool’s usefulness, the researchers applied it to mapping adverse impacts of state renewable portfolio standards (RPS). The exposure they looked at was the effect of RPS on electricity price. Susceptibility was based on past research that shows the elderly, very young, communities of color, people in poverty and people who spend a large proportion of their income on energy are most affected by increases in energy prices. As a measure of adaptive capacity, the researchers used access to national energy assistance programs. The results showed a wide range in vulnerability from county to county in states with an RPS.
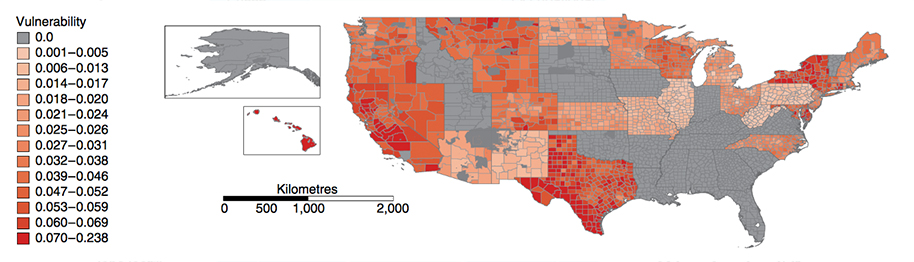
Vulnerability to adverse impacts from renewable portfolio standards can vary dramatically. Reprinted by permission from Springer Nature, Nature Energy, A framework for evaluating geographic disparities in energy transition vulnerability, S. Carley et al., 2018. Click to expand.
The researchers acknowledged that the approach has some limitations. For one, the vulnerability map would likely change over time (for instance, as new businesses arose based on new energy sources) and vary depending on which impacts are considered. In addition, the VSD provides only part of the picture of the societal impacts of an energy transition, since it does not look at the positive impacts and their distribution or at the costs of not implementing the practice under consideration.
Despite these caveats, the team concluded that the metric can serve as a valuable tool for suggesting areas where policy-makers and service providers might focus their efforts as they work to anticipate, minimize and justly distribute adverse impacts as society moves toward a clean energy future. ![]()
Ensia shares solutions-focused stories free of charge through our online magazine and partner media. That means audiences around the world have ready access to stories that can — and do — help them shape a better future. If you value our work, please show your support today.
Yes, I'll support Ensia!