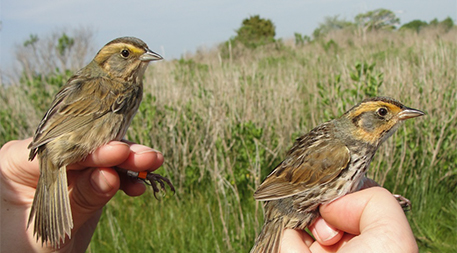
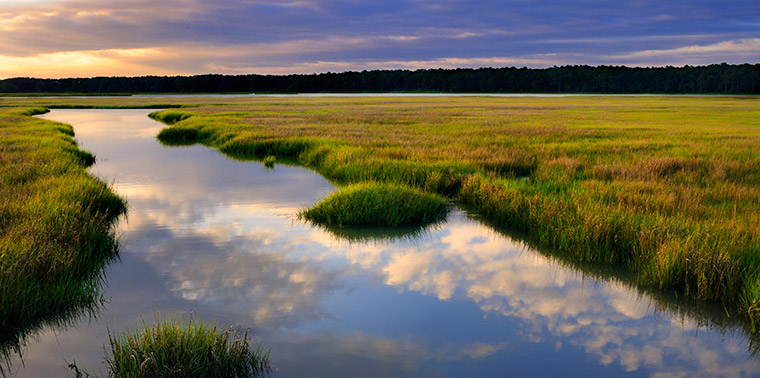
November 4, 2015 — It’s a mild and sunny summer day on the tidal salt marshes at Barn Island Wildlife Management Area, which sits across Little Narragansett bay from Stonington, Connecticut. Walking through a wide, dry stretch of marsh, Chris Elphick, a conservation biologist at the University of Connecticut, focuses a spotting scope on a group of little brown birds hidden among the thigh-high grasses. Elphick identifies the rare saltmarsh sparrow by the yellow shading on its face and the crisp dark streaks on its breast. Saltmarsh sparrows, which represent the most vulnerable of many species that call this habitat home, make their nests in the high marsh among stems of saltmeadow cordgrass, escaping the twice-daily tides that flood the lower marsh. But the Barn Island high marsh and others like it are disappearing as the rising ocean brings salty tides farther inland. Elphick gives the rare sparrow 30 to 40 years before it disappears from the planet.

Conservation biologist Chris Elphick refers to the saltmarsh sparrow (right, shown with a Nelson’s sparrow) as a “canary in a coal mine” for salt marsh habitat threatened by rising sea level. Photo by Chris Elphick.
Time may be running out for some coastal cities, too. While sea level rise is squeezing salt marshes against higher, drier land and human infrastructure, it is likewise moving in on some oceanside neighborhoods.
But sea-level modeling tools hold hope for both. By providing concrete pictures of what coastlines will look like under various climate change scenarios, the models are helping planners identify strategies for protecting saltmarsh habitat while managing existing coastal infrastructure and future development.
Coastal salt marshes — communities of plants and animals defined by the coming and going of ocean tides — form on sediment dropped from slowing river waters and incoming tides. They provide a transition between dry land and ocean, protecting the coast from erosion, providing a home to a rich abundance of plant and animal life, filtering nutrients and other pollutants from runoff, and offering that critical band of Goldilocks habitat for the saltmarsh sparrow and other species that call the marshes home.
The maps give communities information they can use to not only plan for future urban infrastructure, but also make room within that infrastructure for saltmarsh habitat.For thousands of years coastal marshes have kept pace with gradually rising oceans, growing vertically or retreating inland. But the world has changed; the rate of sea level rise has doubled on the Northeast U.S. coastline since 1990, dams keep fresh sediment loads from the coast, and human structures such as roads and sea walls block inland migration. As a result, those who seek to protect these unique ecosystems and the services they provide are looking for ways to help them overcome obstacles to migrating inland.
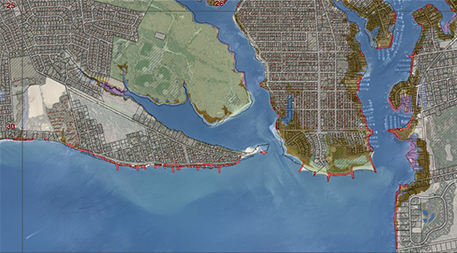
One promising approach involves cooperation between conservationists and city and state planners. Using a coastal mapping tool originally developed for the U.S. Environmental Protection Agency called the Sea Level Affecting Marshes Model, or SLAMM, federal and state agencies and conservation organizations create maps showing where high tide will be as sea level rise increases. The maps give communities information they can use to not only plan for future urban infrastructure, but also make room within that infrastructure for saltmarsh habitat.
Rhode Island has used SLAMM to project ocean flooding for all 21 of its coastal communities. “We found it was a place to start the sea-level rise conversation,” says Caitlin Chaffee, a policy analyst with the Rhode Island Coastal Resources Management Council. “[It pinpoints] opportunities to remove aging infrastructure and to accommodate the wetlands.”
The city of Warwick, for example, worked with CRMC to identify a number of crumbling roads that occasionally flood and will eventually dead-end in the ocean. To close portions of the roads and restore wetland habitat, however, it needed local residents’ buy-in, and the SLAMM maps proved convincing. “We also used the model to show that this particular area along the coastline in Warwick Cove will be inundated in five to 10 years,” says Warwick planning director William DePasquale. Given that reality, he says, it was relatively easy to convince people that it would be better for the city to buy and preserve the land for preservation rather than allow new development that would soon be threatened.
Salt marshes help protect homes along the coast by decreasing water speed and turbulence and diffusing incoming waves.Marc Carullo, environmental analyst for the Massachusetts Office of Coastal Zone Management, says some communities in his area are excited about the model’s potential to help them proactively plan for coastal changes. Currently, salt marshes help protect homes along the coast by decreasing water speed and turbulence and diffusing incoming waves. “If we have large expanses of salt marsh becoming tidal flat, we’re going to lose ecosystem services and that could play a big role in how exposed that homeowner is to storm surge,” he says. The visualizations SLAMM provides, he says, will help motivate communities to protect salt marshes and the services they provide.
Back in Connecticut, SLAMM modeling shows a 50 percent to 97 percent loss of high marsh by 2100. That’s up to 10,000 acres. The model predicts the loss will be mitigated by less than 1,000 acres of potential wetland “gain” at higher elevation — and Elphick says even that is optimistic, since he sees little evidence of marsh migration today except for salt marsh grasses colonizing coastal lawns. He and the little brown saltmarsh sparrow he seeks to protect — indeed, everyone and everything that benefits from the services salt marshes provide — can only hope that the awareness the modeling brings will help coastal communities find a place for salt marshes as they plan for accommodating sea-level rise. ![]()
Editor’s note: Sharon Ashworth produced this article as a participant in the Ensia Mentor Program. Her mentor for the project was independent journalist Erica Gies.
+ + +
Want to get a taste of what your coastal community and its wetlands might face in the future? Try out these interactive maps.
An interactive, simplified Web version of SLAMM is available for limited regions on the Atlantic, Gulf and Pacific coasts (official state maps are published for some states)
The National Oceanic and Atmospheric Administration’s simplified Sea Level Rise Viewer includes sea level rise, marsh impacts and migration, community vulnerability, and flood frequency for the entire U.S. coastline with the exception of the Louisiana coast.
The Nature Conservancy’s Coastal Resilience Mapping Tool includes suggestions for nature-based coastal resiliency adaptations in limited locations.
Ensia shares solutions-focused stories free of charge through our online magazine and partner media. That means audiences around the world have ready access to stories that can — and do — help them shape a better future. If you value our work, please show your support today.
Yes, I'll support Ensia!

